This research project attempted to identify and characterise
Sybil relays in the
Tor network.
Counting millions of daily users, the Tor network is the largest deployed
anonymity network. While the code is developed by The Tor Project, the network
of 7,000 relays is operated by volunteers.
Sybils are a set of these relays that are controlled by a single operator. While
Sybils are not necessarily malicious, they can assist an attacker in
(i) manipulating the network’s distributed hash table,
(ii) tamper with the network’s exit traffic, or
(iii) end-to-end correlate Tor traffic.
Therefore, it is important to identify Sybil groups and remove them from the
network, if they turn out to be malicious.
In this project, we developed techniques to expose Sybil relays, and study the
ones we have already discovered. To this end, we have developed
sybilhunter—a
command line tool to analyse
archived Tor network data
for signs of Sybil relays. We are using sybilhunter to analyse large
piles of data
and generate visualisations, such as the ones shown below.
Relay uptime images
Each hour, Tor’s directory authorities publish the network
consensus—an authoritative list of approximately 7,000 Tor relays that are
currently running. By analysing archived network consensuses, we are able to
visualise the uptime of every single Tor relay that was ever online since 2007.
In particular, we create bitmaps whose columns represent relays and whose rows
represent consensuses. Each pixel shows the online status of a particular relay
at a particular hour. A black pixel means that the relay was online and a white
pixel means that the relay was offline. Red blocks highlight suspiciously
similar uptime patterns. The image below shows an example—an uptime image
for a subset of all relays in January 2014. Note the red blocks; their highly
correlated uptime could mean that they are Sybils, run by the same person. We
created and uploaded monthly uptime dating back to October 2007, all of which
are
available online.
You can create your own uptime images by using sybilhunter’s
“-uptime” command line option.

Relay uptime image for a subset of January 2014.
Relay churn
The churn rate of a
distributed system captures the rate of joining and leaving network
participants—in our case Tor relays. We determine the churn rate between
two consensuses, published at time t-1 and t, by determining the
number of relays that have joined and left the network, respectively. We
normalise this number by the consensus size, which gives us a value in the
interval [0, 1]. We determined the churn rate between two subsequent network
consensuses for all consensuses published since 2007, which leaves us with a
time series of churn values. For each relay flag (e.g., Guard, Exit, and
HSDir), we create a separate time series. The diagram below shows an example,
several days in February 2013, featuring a curious pattern on Monday and
Tuesday.
Monthly time series diagrams are available online.
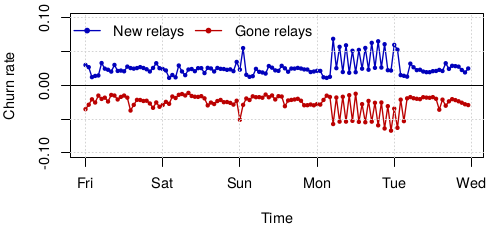
Churn time series for a subset of February 2013.
We also publish our raw data. You can download the following file containing
all churn values since 2007, or create your own dataset using
sybilhunter’s “-churn” parameter.
Observed fingerprints
We analysed monthly batches of consensuses to determine how many fingerprints
each Tor relay—identified by its IP address—used. Relays that change
their fingerprints frequently could be misconfigured, or make an attempt to
manipulate Tor’s distributed hash table. Below is an example output of this
analysis technique, showing four fingerprints that were used by a relay over
January 2016.
94.242.206.35 (4 unique fingerprints)
    0760C0A34CCBCB2614075E27B88151FCC7D047EC (seen 603 times)
    BFD74D651690324DCA9FB744E2D54DDC814DD3FB (seen 603 times)
    667C297D3EC6E1281D68F7F4C8C9BE8324D132A3 (seen 120 times)
    0ED2D734F295427E5A3719FA7B9985C335839123 (seen 120 times)
We publish all monthly fingerprint statistics. You can create your own
statistics using sybilhunter’s “-fingerprint” argument.
Sybil groups
We created an archive that contains the raw data for the Sybil groups we discuss
in our research paper. You can use this archive to verify our results or extend
our work. The archive contains a README.txt file that explains the directory
structure.
A lot of engineering effort went into
sybilhunter,
our command line tool to expose and analyse Sybil relays. The tool is implemented in Go and
uses our parsing library
zoossh.
Sybilhunter takes as input archived network data from
CollecTor
and produces visualisations and CSV files, as the ones shown above.
To get sybilhunter, you can
download a tarball,
or fetch the most recent version over the command line:
go get github.com/NullHypothesis/sybilhunter
Sybilhunter’s
README file
explains its usage.
For convenience, we reimplemented nearest neighbour ranking—a subset of
sybilhunter’s functionality—in Python. The tool is called trnnr
(short for Tor relay nearest neighbour
ranking) and is available online as well:
git clone https://github.com/NullHypothesis/trnnr
Running the tool is as simple as passing it a relay fingerprint, as its
README shows.
This research was supported in part by the
Center for Information Technology Policy
at Princeton University.
If you have any questions or feedback, please don’t hesitate to get in touch with us.
 Identifying and characterizing Sybils in the Tor network
 (
( (
( (
( (
(